MICROARRAY DATA EXAMPLE:
Recent technological advances such as cDNA microarray technology have made it possible to simultaneously interrogate thousands of genes in a biological specimen, based on the relative abundance of each gene's mRNA, by using a two-color fluorescent probe hybridization system. The gene expression profile obtained for a specimen consists of log transformed normalized expression ratios measured on the full set of genes represented in the microarray. For a given spot (e.g. gene) on an array, the expression ratio is formed by dividing the fluorescent signal measured for a test sample at that spot by the fluorescent signal measured from a reference sample. Cluster analysis techniques have frequently been used for investigating structure in microarray data. Co-expressed genes in the same cluster are probably involved in the same cellular process, and strong correlation between gene expression patterns indicates co-regulation. Once a clustering algorithm has grouped similar objects (genes or samples) together, the biologist is then faced with the task of interpreting these clusters. For example, if a gene of unknown function is clustered together with many genes of similar, known function, one might hypothesize that the unknown gene also has a related function.
As an example to demonstrate the performance of GINKGO, we include here the analysis of data from a study of human fibroblast differential expression after serum addition. We chose for our analysis a subset of 517 genes which was studied in Iyer et al. (1999) with hierarchical clustering methods, concluding that 10 different clusters could be distinguished. It can be downloaded at http://www.sciencemag.org/feature/data/984559.shl.
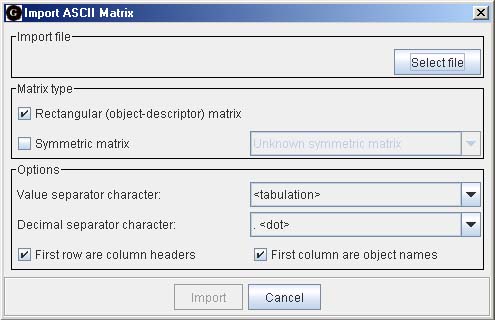
First data must be imported, and a dialog similar to the one at the left appears.Several file import options are available, including ASCII plain text using different value separators. Data matrices are exported by writing ASCII files or through the system clipboard.
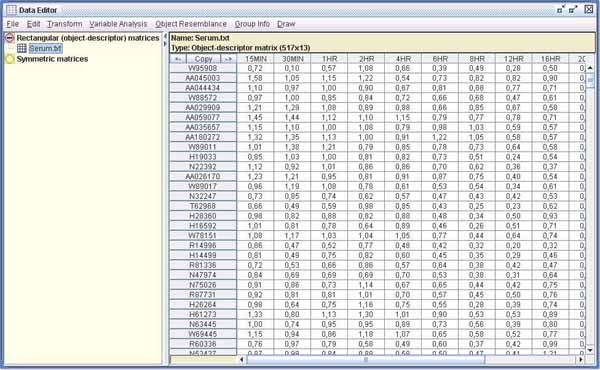
Two matrix types are accepted: rectangular and symmetric. The panel below shows the data once it has been imported.As with other statistical programs, univariate descriptive statistics, as well as variable correlation and covariance matrices, can be calculated.
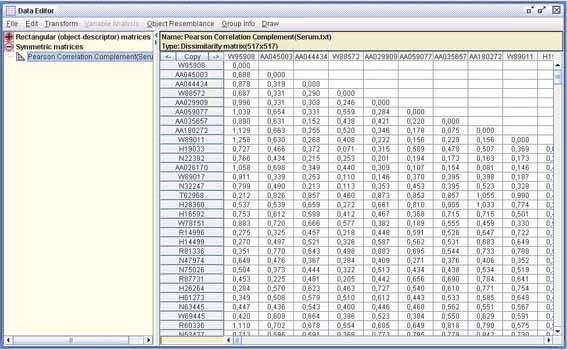
Symmetric matrices are normally created from a rectangular matrix and selecting among 9 different similarity or 13 different dissimilarity indices. Here we computed the complementary dissimilarity of Pearson correlation coefficient between genes. It is usual with this kind of data to measure gene resemblance using the Pearson correlation coefficient, as it measures the similarity of their patterns in the sense of how closely the values in one pattern can be approximated by a linear function of the values in the other.
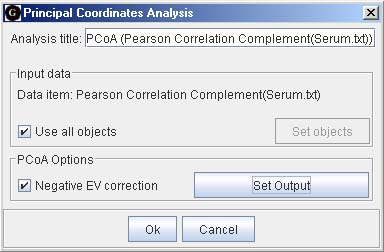
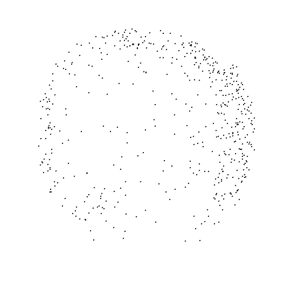
In order to graphically display the scatter of the dissimilarity matrix obtained, we computed classical MDS (or Principal Coordinates Analysis) with correction for negative eigenvalues (dialog on the right). The first two principal coordinates are shown in the figure below left.
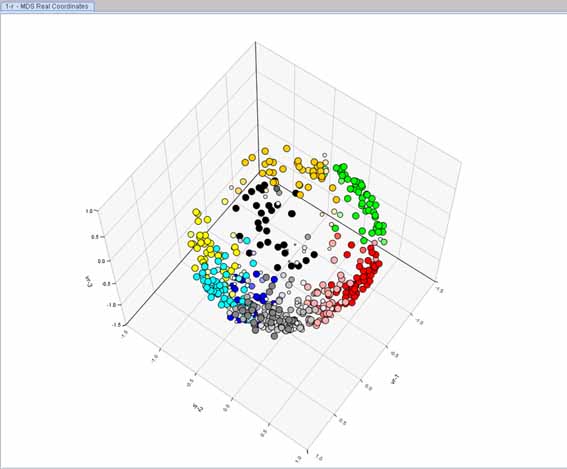
The program allows the application of three different cluster models: hierarchical, partitioning, and cluster independent. In our case and to explore the cluster structure of this data set, we ran FCM on the dissimilarity matrix using c = 10 and m = 1.25. The relative membership matrix obtained is displayed in the figure below right (in a 3D plot). As can be seen in this figure, the results of multivariate data representation methods can be displayed in 2D (or even 3D) scatter diagrams. In addition, any available classification matrix in the Analyses Manager, either fuzzy or crisp, may be used to label objects in scatter diagrams, making it possible to interpret data structure by combining the patterns revealed from both classification and ordination methods.
Bibliography
V. R. Iyer, M.B. Eisen, D.T. Ross, G. Schuler, T. Moore, J.C.F. Lee, J.M. Trent, L.M. Staudt, J. Hudson Jr., M.S. Boguski, D. Lashkari, D. Shalon, D. Botstein, P.O. Brown, The transcriptional program in the response of human fibroblasts to serum, Science (1999) 83-87.